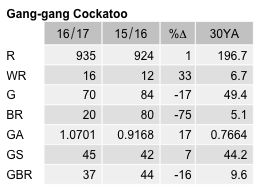
Gang-gang Cockatoo
Callocephalon fimbriatum
ABR description
The following is extracted from the Annual Bird Report for the twelve months to June 2017.
Common, breeding resident/alt. migrant
Often found in the older areas of Canberra. Declared Vulnerable in NSW.
General: Reporting rate (6.8%) 14% lower than last year and 6% below the 30YA of 7.2%. Average 2.8, median 2 with max 39/2 May ANU (MiP1). Recorded all year but fewer records in summer (18%) and higher in spring (31%). 22 breeding records (80 last year): earliest dy/21 Jul Mt Ainslie NR Grl13 (HoS1), latest dy/30 May ANBG (BeL3) with an early start for the next season ih/28 Jun ANU GrK13 (CrK3).
GBS: 819 records from 45 sites (76%) from all weeks of up to 29 individuals. Average 3.4, median 2 with max 29/1wk Apr Curtin GrK14 (AjR1), with little seasonable variation although slightly fewer records in winter (22%) and more records in autumn (32%). Abundance was 17% higher than last year, well below the peak of 2012-13 (A=1.27) but 40% above the 30YA. Records from throughout Canberra. 37 breeding records (44 last year) from 8 sites with first breeding record dy/1 wk Curtin GrK14 (MoM3) and last dy/4 wk Weston GrJ15 (BoJ1).
Abundance
Abundance is the average number of birds of that species per survey. Where the species was observed (presence recorded) but the number of birds seen was not recorded, this is treated as a count of zero.
Abundance by year
This chart shows the abundance of Gang-gang Cockatoo between 1982 and 2017. 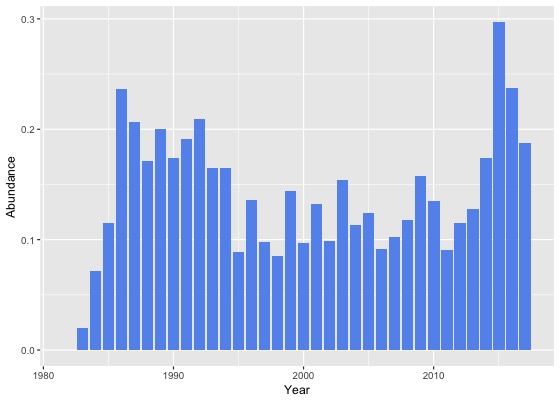
Abundance by month
This chart shows the monthly abundance of Gang-gang Cockatoo. The blue lines show the abundance for the twelve months to June 2017 and the bars show the average abundance for the period 1982 to 2017. 
Abundance by season
This chart shows the seasonal abundance of Gang-gang Cockatoo. The blue lines show the seasonal abundance for the twelve months to June 2017 and the bars show the average seasonal abundance for the period 1982 to 2017. 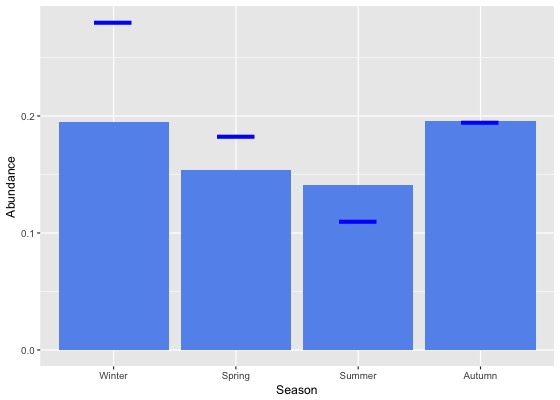
Abundance data
| Month | Season | ||||||||||||||||||
|---|---|---|---|---|---|---|---|---|---|---|---|---|---|---|---|---|---|---|---|
| Period | Jul | Aug | Sep | Oct | Nov | Dec | Jan | Feb | Mar | Apr | May | Jun | Winter | Spring | Summer | Autumn | All | ||
| All years | |||||||||||||||||||
| All | 0.2 | 0.3 | 0.2 | 0.2 | 0.1 | 0.1 | 0.2 | 0.2 | 0.2 | 0.2 | 0.3 | 0.2 | 0.2 | 0.2 | 0.1 | 0.2 | 0.2 | ||
| Previous years | |||||||||||||||||||
| All previous years | 0.2 | 0.2 | 0.2 | 0.2 | 0.1 | 0.1 | 0.2 | 0.2 | 0.2 | 0.2 | 0.2 | 0.1 | 0.2 | 0.1 | 0.1 | 0.2 | 0.2 | ||
| Previous 30 years | 0.2 | 0.2 | 0.2 | 0.2 | 0.1 | 0.1 | 0.2 | 0.2 | 0.2 | 0.2 | 0.3 | 0.1 | 0.2 | 0.2 | 0.1 | 0.2 | 0.2 | ||
| Previous 20 years | 0.2 | 0.3 | 0.2 | 0.2 | 0.1 | 0.1 | 0.2 | 0.2 | 0.2 | 0.2 | 0.3 | 0.1 | 0.2 | 0.1 | 0.1 | 0.2 | 0.2 | ||
| 10 year groups | |||||||||||||||||||
| [2007,2017) | 0.2 | 0.3 | 0.2 | 0.2 | 0.1 | 0.1 | 0.2 | 0.2 | 0.2 | 0.2 | 0.3 | 0.2 | 0.2 | 0.2 | 0.1 | 0.2 | 0.2 | ||
| [1997,2007) | 0.2 | 0.2 | 0.1 | 0.1 | 0.1 | 0.1 | 0.1 | 0.1 | 0.1 | 0.1 | 0.1 | 0.1 | 0.1 | 0.1 | 0.1 | 0.1 | 0.1 | ||
| [1987,1997) | 0.2 | 0.1 | 0.1 | 0.2 | 0.2 | 0.2 | 0.2 | 0.2 | 0.3 | 0.2 | 0.2 | 0.1 | 0.1 | 0.2 | 0.2 | 0.2 | 0.2 | ||
| 5 year groups | |||||||||||||||||||
| [2012,2017) | 0.2 | 0.3 | 0.3 | 0.2 | 0.1 | 0.1 | 0.2 | 0.2 | 0.2 | 0.2 | 0.4 | 0.2 | 0.3 | 0.2 | 0.2 | 0.3 | 0.2 | ||
| [2007,2012) | 0.0 | 0.1 | 0.1 | 0.2 | 0.1 | 0.1 | 0.1 | 0.1 | 0.1 | 0.1 | 0.1 | 0.1 | 0.1 | 0.1 | 0.1 | 0.1 | 0.1 | ||
| [2002,2007) | 0.1 | 0.2 | 0.1 | 0.1 | 0.1 | 0.1 | 0.1 | 0.1 | 0.1 | 0.1 | 0.1 | 0.1 | 0.1 | 0.1 | 0.1 | 0.1 | 0.1 | ||
| [1997,2002) | 0.3 | 0.2 | 0.1 | 0.1 | 0.1 | 0.1 | 0.2 | 0.1 | 0.1 | 0.1 | 0.1 | 0.1 | 0.2 | 0.1 | 0.1 | 0.1 | 0.1 | ||
| [1992,1997) | 0.2 | 0.1 | 0.1 | 0.1 | 0.2 | 0.1 | 0.1 | 0.1 | 0.2 | 0.1 | 0.2 | 0.1 | 0.1 | 0.1 | 0.1 | 0.2 | 0.1 | ||
| [1987,1992) | 0.2 | 0.1 | 0.2 | 0.2 | 0.2 | 0.2 | 0.2 | 0.2 | 0.3 | 0.2 | 0.2 | 0.1 | 0.1 | 0.2 | 0.2 | 0.2 | 0.2 | ||
| Year | |||||||||||||||||||
| 2017 | 0.3 | 0.4 | 0.2 | 0.2 | 0.2 | 0.1 | 0.1 | 0.1 | 0.1 | 0.2 | 0.3 | 0.2 | 0.3 | 0.2 | 0.1 | 0.2 | 0.2 | ||
| 2016 | 0.3 | 0.4 | 0.3 | 0.2 | 0.1 | 0.1 | 0.1 | 0.2 | 0.2 | 0.3 | 0.4 | 0.3 | 0.3 | 0.2 | 0.2 | 0.3 | 0.2 | ||
| 2015 | 0.5 | 0.6 | 0.4 | 0.2 | 0.1 | 0.1 | 0.2 | 0.2 | 0.3 | 0.4 | 0.6 | 0.3 | 0.4 | 0.2 | 0.2 | 0.4 | 0.3 | ||
| 2014 | 0.1 | 0.1 | 0.2 | 0.2 | 0.1 | 0.1 | 0.3 | 0.2 | 0.2 | 0.1 | 0.3 | 0.1 | 0.1 | 0.2 | 0.2 | 0.2 | 0.2 | ||
| 2013 | 0.1 | 0.1 | 0.1 | 0.1 | 0.1 | 0.1 | 0.1 | 0.1 | 0.2 | 0.1 | 0.2 | 0.2 | 0.1 | 0.1 | 0.1 | 0.1 | 0.1 | ||
| 2012 | 0.0 | 0.1 | 0.1 | 0.2 | 0.1 | 0.1 | 0.1 | 0.1 | 0.1 | 0.1 | 0.1 | 0.1 | 0.1 | 0.1 | 0.1 | 0.1 | 0.1 | ||
| 2011 | 0.1 | 0.1 | 0.2 | 0.1 | 0.1 | 0.1 | 0.1 | 0.1 | 0.1 | 0.1 | 0.1 | 0.1 | 0.1 | 0.1 | 0.1 | 0.1 | 0.1 | ||
| 2010 | 0.1 | 0.2 | 0.1 | 0.2 | 0.0 | 0.1 | 0.1 | 0.1 | 0.1 | 0.2 | 0.4 | 0.2 | 0.2 | 0.1 | 0.1 | 0.2 | 0.1 | ||
| 2009 | 0.0 | 0.1 | 0.1 | 0.2 | 0.1 | 0.1 | 0.3 | 0.2 | 0.2 | 0.1 | 0.1 | 0.2 | 0.1 | 0.2 | 0.2 | 0.1 | 0.2 | ||
| 2008 | 0.0 | 0.3 | 0.1 | 0.2 | 0.1 | 0.0 | 0.1 | 0.2 | 0.1 | 0.1 | 0.1 | 0.0 | 0.1 | 0.1 | 0.1 | 0.1 | 0.1 | ||
| 2007 | 0.0 | 0.0 | 0.0 | 0.1 | 0.1 | 0.1 | 0.1 | 0.0 | 0.2 | 0.2 | 0.1 | 0.0 | 0.0 | 0.1 | 0.1 | 0.2 | 0.1 | ||
| 2006 | 0.1 | 0.1 | 0.2 | 0.1 | 0.1 | 0.1 | 0.1 | 0.0 | 0.1 | 0.0 | 0.1 | 0.0 | 0.1 | 0.1 | 0.1 | 0.1 | 0.1 | ||
| 2005 | 0.0 | 0.5 | 0.1 | 0.1 | 0.1 | 0.1 | 0.1 | 0.3 | 0.1 | 0.2 | 0.1 | 0.1 | 0.2 | 0.1 | 0.2 | 0.1 | 0.1 | ||
| 2004 | 0.1 | 0.1 | 0.1 | 0.1 | 0.1 | 0.2 | 0.2 | 0.1 | 0.1 | 0.1 | 0.2 | 0.0 | 0.1 | 0.1 | 0.2 | 0.1 | 0.1 | ||
| 2003 | 0.3 | 0.3 | 0.2 | 0.1 | 0.1 | 0.1 | 0.1 | 0.2 | 0.2 | 0.2 | 0.2 | 0.0 | 0.2 | 0.1 | 0.1 | 0.2 | 0.2 | ||
| 2002 | 0.1 | 0.1 | 0.1 | 0.0 | 0.1 | 0.1 | 0.1 | 0.1 | 0.1 | 0.1 | 0.1 | 0.2 | 0.1 | 0.1 | 0.1 | 0.1 | 0.1 | ||
| 2001 | 0.2 | 0.1 | 0.1 | 0.1 | 0.0 | 0.2 | 0.2 | 0.1 | 0.1 | 0.2 | 0.2 | 0.2 | 0.2 | 0.1 | 0.2 | 0.1 | 0.1 | ||
| 2000 | 0.2 | 0.1 | 0.1 | 0.1 | 0.1 | 0.1 | 0.1 | 0.2 | 0.2 | 0.0 | 0.0 | 0.1 | 0.1 | 0.1 | 0.1 | 0.1 | 0.1 | ||
| 1999 | 0.9 | 0.5 | 0.2 | 0.1 | 0.1 | 0.1 | 0.2 | 0.2 | 0.1 | 0.1 | 0.1 | 0.0 | 0.2 | 0.1 | 0.2 | 0.1 | 0.1 | ||
| 1998 | 0.7 | 0.1 | 0.1 | 0.0 | 0.0 | 0.0 | 0.1 | 0.1 | 0.1 | 0.3 | 0.0 | 0.0 | 0.2 | 0.0 | 0.1 | 0.1 | 0.1 | ||
| 1997 | 0.2 | 0.0 | 0.0 | 0.1 | 0.0 | 0.1 | 0.2 | 0.0 | 0.3 | 0.2 | 0.1 | 0.0 | 0.1 | 0.0 | 0.1 | 0.2 | 0.1 | ||
| 1996 | 0.1 | 0.1 | 0.1 | 0.1 | 0.5 | 0.2 | 0.0 | 0.1 | 0.0 | 0.3 | 0.1 | 0.0 | 0.1 | 0.2 | 0.1 | 0.1 | 0.1 | ||
| 1995 | 0.1 | 0.1 | 0.0 | 0.0 | 0.1 | 0.1 | 0.1 | 0.0 | 0.0 | 0.2 | 0.0 | 0.2 | 0.1 | 0.1 | 0.1 | 0.1 | 0.1 | ||
| 1994 | 0.0 | 0.1 | 0.1 | 0.1 | 0.0 | 0.1 | 0.2 | 0.1 | 0.5 | 0.0 | 0.4 | 0.3 | 0.1 | 0.1 | 0.2 | 0.3 | 0.2 | ||
| 1993 | 0.0 | 0.2 | 0.2 | 0.0 | 0.1 | 0.0 | 0.3 | 0.2 | 0.5 | 0.0 | 0.3 | 0.0 | 0.1 | 0.1 | 0.2 | 0.3 | 0.2 | ||
| 1992 | 0.5 | 0.1 | 0.1 | 0.3 | 0.6 | 0.1 | 0.0 | 0.2 | 0.1 | 0.2 | 0.3 | 0.0 | 0.2 | 0.3 | 0.1 | 0.2 | 0.2 | ||
| 1991 | 0.3 | 0.1 | 0.1 | 0.2 | 0.1 | 0.1 | 0.5 | 0.3 | 0.2 | 0.2 | 0.3 | 0.0 | 0.2 | 0.1 | 0.3 | 0.2 | 0.2 | ||
| 1990 | 0.1 | 0.1 | 0.1 | 0.1 | 0.1 | 0.1 | 0.2 | 0.2 | 0.5 | 0.1 | 0.7 | 0.3 | 0.1 | 0.1 | 0.1 | 0.4 | 0.2 | ||
| 1989 | 0.2 | 0.1 | 0.3 | 0.2 | 0.2 | 0.2 | 0.2 | 0.3 | 0.2 | 0.2 | 0.1 | 0.1 | 0.1 | 0.2 | 0.3 | 0.2 | 0.2 | ||
| 1988 | 0.1 | 0.1 | 0.1 | 0.2 | 0.1 | 0.2 | 0.3 | 0.2 | 0.2 | 0.2 | 0.2 | 0.2 | 0.1 | 0.2 | 0.2 | 0.2 | 0.2 | ||
| 1987 | 0.5 | 0.7 | 0.2 | 0.3 | 0.2 | 0.2 | 0.2 | 0.2 | 0.2 | 0.2 | 0.1 | 0.1 | 0.2 | 0.2 | 0.2 | 0.2 | 0.2 | ||
| 1986 | 0.0 | 0.2 | 0.1 | 0.1 | 0.2 | 0.1 | 0.5 | 0.2 | 0.4 | 0.5 | 0.4 | 0.1 | 0.1 | 0.1 | 0.2 | 0.4 | 0.2 | ||
| 1985 | 0.2 | 0.2 | 0.0 | 0.0 | 0.1 | 0.2 | 0.1 | 0.1 | 0.6 | 0.1 | 0.0 | 0.2 | 0.2 | 0.0 | 0.2 | 0.2 | 0.1 | ||
| 1984 | 0.0 | 0.0 | 0.0 | 0.0 | 0.0 | 0.0 | 0.0 | 0.0 | 0.1 | 0.4 | 0.0 | 0.0 | 0.0 | 0.0 | 0.0 | 0.2 | 0.1 | ||
| 1983 | 0.0 | 0.0 | 0.0 | 0.1 | 0.1 | 0.0 | 0.0 | 0.0 | 0.0 | - | 0.0 | 0.0 | 0.0 | 0.1 | 0.0 | 0.0 | 0.0 | ||
| 1982 | - | 0.0 | - | 0.0 | 0.0 | 0.0 | - | 0.0 | - | 0.0 | - | 0.0 | 0.0 | 0.0 | 0.0 | 0.0 | 0.0 | ||
Reporting rates
Reporting rate is the proportion of all surveys in which the species was present.
Reporting rate by year
This chart shows the reporting rate of Gang-gang Cockatoo each year between 1982 and 2017. 
Reporting rate by month
This chart shows the reporting rate by month of Gang-gang Cockatoo. The blue lines show the reporting rate for the twelve months to June 2017 and the bars show the average reporting rate for the period 1982 to 2017. 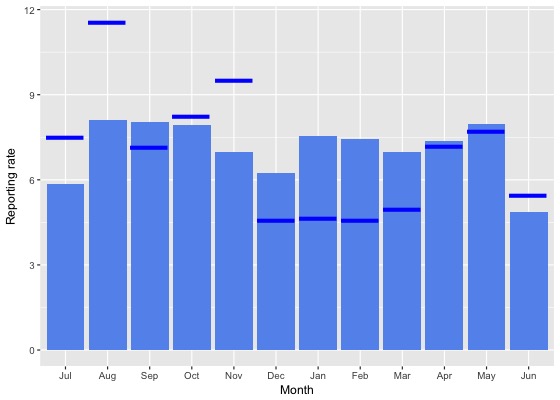
Reporting rate by season
This chart shows the seasonal reporting rate of Gang-gang Cockatoo. The blue lines show the seasonal reporting rate for the twelve months to June 2017 and the bars show the average seasonal reporting rate for the period 1982 to 2017. 
Reporting rate data
| Month | Season | ||||||||||||||||||
|---|---|---|---|---|---|---|---|---|---|---|---|---|---|---|---|---|---|---|---|
| Period | Jul | Aug | Sep | Oct | Nov | Dec | Jan | Feb | Mar | Apr | May | Jun | Winter | Spring | Summer | Autumn | All | ||
| All years | |||||||||||||||||||
| All | 5.9 | 8.1 | 8.0 | 7.9 | 7.0 | 6.2 | 7.6 | 7.4 | 7.0 | 7.4 | 8.0 | 4.9 | 6.1 | 7.7 | 7.1 | 7.4 | 7.1 | ||
| Previous years | |||||||||||||||||||
| All previous years | 5.6 | 7.4 | 8.2 | 7.9 | 6.6 | 6.5 | 8.1 | 8.0 | 7.3 | 7.4 | 8.0 | 4.7 | 5.8 | 7.6 | 7.5 | 7.5 | 7.2 | ||
| Previous 30 years | 5.6 | 7.4 | 8.2 | 8.0 | 6.5 | 6.5 | 8.1 | 8.1 | 7.3 | 7.4 | 8.0 | 4.7 | 5.8 | 7.7 | 7.5 | 7.5 | 7.2 | ||
| Previous 20 years | 4.8 | 7.0 | 7.2 | 6.9 | 4.7 | 4.9 | 6.9 | 6.6 | 6.0 | 6.5 | 7.2 | 3.8 | 5.0 | 6.4 | 6.1 | 6.5 | 6.1 | ||
| 10 year groups | |||||||||||||||||||
| [2007,2017) | 4.8 | 6.8 | 7.5 | 7.3 | 4.6 | 5.0 | 6.8 | 6.6 | 6.3 | 6.7 | 7.6 | 4.0 | 5.1 | 6.7 | 6.2 | 6.7 | 6.3 | ||
| [1997,2007) | 4.8 | 7.4 | 6.7 | 5.6 | 4.9 | 4.7 | 7.2 | 6.5 | 5.5 | 6.0 | 6.1 | 3.3 | 4.9 | 5.8 | 5.9 | 5.8 | 5.6 | ||
| [1987,1997) | 8.4 | 8.7 | 13.5 | 14.3 | 12.6 | 15.6 | 15.3 | 15.3 | 14.6 | 11.9 | 11.1 | 9.3 | 8.8 | 13.5 | 15.4 | 12.6 | 12.6 | ||
| 5 year groups | |||||||||||||||||||
| [2012,2017) | 5.6 | 7.3 | 8.6 | 7.6 | 4.8 | 5.6 | 6.9 | 6.9 | 6.6 | 8.0 | 8.6 | 4.9 | 5.9 | 7.2 | 6.5 | 7.6 | 6.9 | ||
| [2007,2012) | 2.7 | 4.8 | 4.8 | 6.8 | 3.9 | 3.6 | 6.6 | 5.6 | 5.3 | 3.6 | 4.9 | 2.4 | 3.0 | 5.7 | 5.1 | 4.5 | 4.8 | ||
| [2002,2007) | 4.1 | 7.9 | 7.3 | 5.7 | 5.9 | 4.7 | 6.9 | 5.9 | 5.2 | 5.3 | 6.4 | 3.6 | 4.8 | 6.3 | 5.6 | 5.5 | 5.6 | ||
| [1997,2002) | 6.1 | 6.8 | 5.9 | 5.3 | 3.9 | 4.7 | 7.4 | 7.2 | 5.8 | 6.7 | 5.6 | 2.9 | 5.0 | 5.1 | 6.2 | 6.1 | 5.6 | ||
| [1992,1997) | 3.1 | 4.2 | 3.6 | 5.1 | 4.7 | 3.8 | 5.1 | 4.7 | 6.1 | 4.3 | 5.2 | 3.3 | 3.5 | 4.5 | 4.5 | 5.2 | 4.5 | ||
| [1987,1992) | 10.8 | 11.2 | 18.2 | 19.3 | 16.5 | 20.7 | 20.8 | 19.3 | 19.7 | 16.3 | 14.2 | 12.8 | 11.6 | 18.0 | 20.3 | 16.7 | 16.7 | ||
| Year | |||||||||||||||||||
| 2017 | 7.5 | 11.5 | 7.1 | 8.2 | 9.5 | 4.6 | 4.7 | 4.6 | 5.0 | 7.2 | 7.7 | 5.4 | 7.9 | 8.3 | 4.6 | 6.5 | 6.8 | ||
| 2016 | 7.3 | 8.2 | 12.3 | 10.8 | 6.2 | 6.4 | 6.2 | 6.5 | 5.9 | 8.4 | 8.1 | 7.8 | 7.8 | 10.1 | 6.4 | 7.4 | 7.9 | ||
| 2015 | 6.3 | 11.9 | 9.9 | 5.8 | 4.0 | 5.7 | 7.6 | 7.9 | 7.9 | 12.1 | 10.8 | 4.4 | 7.0 | 6.6 | 7.1 | 10.2 | 7.7 | ||
| 2014 | 3.6 | 4.6 | 7.3 | 7.5 | 3.7 | 4.6 | 8.3 | 6.0 | 6.3 | 3.8 | 8.5 | 4.2 | 4.2 | 6.7 | 6.9 | 6.0 | 6.1 | ||
| 2013 | 5.0 | 2.7 | 4.6 | 5.4 | 4.6 | 5.3 | 5.3 | 8.2 | 7.1 | 6.5 | 7.1 | 2.9 | 3.5 | 4.9 | 6.0 | 6.9 | 5.5 | ||
| 2012 | 1.6 | 3.1 | 2.7 | 6.1 | 4.4 | 4.9 | 6.8 | 4.9 | 6.0 | 4.7 | 5.9 | 2.4 | 2.4 | 4.8 | 5.8 | 5.4 | 4.7 | ||
| 2011 | 3.3 | 5.6 | 6.2 | 4.2 | 3.0 | 3.9 | 8.0 | 5.0 | 3.8 | 3.4 | 3.3 | 1.7 | 2.9 | 4.6 | 5.7 | 3.5 | 4.3 | ||
| 2010 | 3.1 | 2.6 | 3.4 | 8.2 | 2.9 | 3.3 | 3.9 | 4.7 | 3.1 | 4.7 | 10.8 | 3.4 | 3.2 | 5.7 | 3.7 | 5.1 | 4.6 | ||
| 2009 | 0.7 | 4.2 | 4.9 | 7.7 | 4.5 | 3.7 | 8.7 | 8.3 | 6.5 | 4.1 | 2.3 | 2.7 | 2.4 | 6.3 | 6.5 | 4.6 | 5.2 | ||
| 2008 | 2.8 | 8.7 | 4.5 | 6.9 | 5.4 | 2.7 | 6.3 | 7.4 | 7.5 | 2.8 | 4.5 | 1.9 | 3.8 | 6.0 | 4.8 | 4.5 | 5.0 | ||
| 2007 | 4.4 | 2.8 | 5.4 | 6.8 | 4.1 | 4.4 | 5.9 | 2.6 | 6.8 | 3.4 | 6.5 | 2.3 | 2.8 | 5.9 | 4.6 | 5.4 | 4.9 | ||
| 2006 | 4.6 | 6.8 | 8.4 | 5.4 | 4.8 | 3.9 | 6.7 | 2.2 | 3.2 | 2.2 | 6.5 | 2.3 | 3.9 | 6.1 | 4.5 | 3.6 | 4.6 | ||
| 2005 | 2.9 | 4.7 | 5.9 | 7.2 | 9.0 | 6.4 | 7.8 | 8.7 | 3.9 | 5.5 | 3.5 | 3.8 | 3.8 | 7.1 | 7.2 | 4.2 | 5.5 | ||
| 2004 | 4.0 | 9.9 | 7.7 | 7.6 | 5.2 | 6.5 | 7.9 | 5.1 | 5.2 | 4.9 | 4.9 | 1.8 | 4.9 | 6.9 | 6.7 | 5.0 | 5.9 | ||
| 2003 | 7.7 | 12.2 | 8.1 | 5.7 | 3.7 | 2.5 | 5.9 | 9.9 | 7.6 | 7.8 | 11.6 | 4.3 | 7.9 | 5.9 | 5.8 | 8.6 | 7.0 | ||
| 2002 | 2.3 | 4.2 | 6.5 | 3.9 | 7.5 | 4.1 | 6.3 | 3.3 | 7.3 | 6.0 | 7.1 | 5.9 | 4.2 | 5.8 | 4.5 | 6.8 | 5.3 | ||
| 2001 | 5.8 | 4.8 | 4.7 | 5.5 | 4.0 | 7.2 | 7.0 | 5.7 | 3.0 | 8.8 | 5.8 | 3.9 | 4.9 | 4.8 | 6.7 | 5.4 | 5.4 | ||
| 2000 | 4.0 | 9.2 | 6.0 | 6.6 | 5.1 | 4.7 | 7.9 | 7.6 | 8.6 | 5.8 | 3.6 | 4.8 | 6.0 | 5.9 | 6.5 | 6.5 | 6.3 | ||
| 1999 | 14.7 | 8.2 | 12.6 | 5.0 | 6.5 | 5.0 | 7.3 | 11.4 | 5.4 | 5.7 | 7.4 | 0.9 | 4.3 | 8.2 | 7.8 | 6.1 | 6.7 | ||
| 1998 | 10.8 | 7.5 | 4.1 | 2.2 | 0.9 | 0.9 | 7.4 | 5.7 | 4.3 | 5.1 | 0.0 | 2.7 | 6.1 | 2.4 | 4.0 | 3.8 | 3.8 | ||
| 1997 | 4.6 | 3.4 | 0.9 | 5.3 | 0.9 | 1.0 | 7.8 | 1.8 | 17.5 | 7.3 | 6.7 | 1.4 | 3.2 | 2.0 | 2.8 | 9.3 | 4.0 | ||
| 1996 | 1.5 | 3.2 | 4.0 | 4.4 | 3.7 | 4.0 | 1.9 | 5.9 | 2.0 | 7.8 | 5.2 | 0.0 | 1.6 | 4.0 | 3.8 | 4.5 | 3.5 | ||
| 1995 | 4.3 | 4.7 | 3.9 | 2.4 | 2.7 | 3.4 | 4.4 | 3.2 | 2.0 | 6.5 | 1.3 | 3.2 | 4.1 | 2.9 | 3.8 | 3.7 | 3.6 | ||
| 1994 | 0.0 | 3.9 | 1.5 | 8.1 | 2.2 | 8.7 | 5.9 | 3.4 | 6.8 | 1.5 | 2.5 | 5.6 | 3.7 | 3.8 | 5.8 | 3.3 | 4.0 | ||
| 1993 | 2.0 | 6.4 | 4.8 | 2.7 | 7.6 | 2.2 | 14.3 | 3.1 | 16.0 | 0.0 | 7.8 | 4.3 | 4.6 | 4.9 | 7.1 | 8.7 | 6.3 | ||
| 1992 | 6.2 | 1.9 | 3.5 | 9.6 | 11.1 | 1.6 | 3.4 | 7.3 | 5.6 | 6.8 | 9.2 | 3.3 | 3.9 | 8.0 | 3.7 | 7.3 | 6.0 | ||
| 1991 | 5.5 | 6.4 | 3.5 | 7.8 | 5.2 | 6.8 | 8.9 | 10.0 | 7.9 | 8.5 | 4.9 | 0.0 | 4.8 | 5.6 | 8.3 | 7.1 | 6.2 | ||
| 1990 | 8.4 | 7.0 | 9.7 | 6.1 | 7.5 | 8.3 | 19.4 | 15.5 | 5.7 | 4.8 | 15.1 | 17.1 | 9.4 | 7.7 | 14.4 | 8.2 | 9.6 | ||
| 1989 | 17.9 | 11.6 | 26.2 | 17.7 | 20.7 | 24.8 | 23.4 | 26.3 | 23.9 | 19.5 | 14.5 | 10.7 | 13.4 | 21.4 | 24.8 | 19.5 | 19.9 | ||
| 1988 | 9.1 | 15.3 | 14.0 | 21.1 | 13.8 | 22.6 | 26.6 | 16.6 | 22.8 | 18.7 | 16.7 | 15.5 | 13.3 | 16.5 | 22.1 | 19.4 | 17.5 | ||
| 1987 | 18.2 | 13.3 | 22.3 | 28.9 | 22.4 | 23.7 | 16.4 | 18.8 | 22.5 | 17.7 | 14.0 | 13.2 | 13.5 | 24.3 | 19.7 | 17.9 | 20.2 | ||
| 1986 | 3.8 | 10.5 | 5.7 | 5.6 | 12.8 | 5.9 | 13.0 | 5.6 | 9.7 | 13.7 | 20.7 | 5.7 | 7.1 | 8.1 | 7.5 | 14.4 | 9.3 | ||
| 1985 | 6.7 | 13.3 | 1.9 | 1.2 | 7.0 | 8.3 | 12.5 | 11.8 | 18.2 | 5.3 | 20.0 | 17.9 | 12.5 | 3.1 | 9.4 | 12.5 | 7.4 | ||
| 1984 | 0.0 | 0.0 | 0.0 | 0.0 | 0.0 | 0.0 | 0.0 | 0.0 | 7.4 | 5.9 | 0.0 | 2.9 | 2.0 | 0.0 | 0.0 | 4.3 | 2.1 | ||
| 1983 | 0.0 | 0.0 | 0.0 | 7.7 | 11.1 | 0.0 | 0.0 | 0.0 | 0.0 | - | 0.0 | 0.0 | 0.0 | 7.4 | 0.0 | 0.0 | 2.0 | ||
| 1982 | - | 0.0 | - | 0.0 | 0.0 | 0.0 | - | 0.0 | - | 0.0 | - | 0.0 | 0.0 | 0.0 | 0.0 | 0.0 | 0.0 | ||
Breeding data
Breeding records by month
Number of breeding records by breeding code and month, 2017 and all years| Breeding code | Jul | Aug | Sep | Oct | Nov | Dec | Jan | Feb | Mar | Apr | May | Jun |
|---|---|---|---|---|---|---|---|---|---|---|---|---|
| 2017 | ||||||||||||
| Breeding (BLA code) | 0 | 0 | 0 | 2 | 1 | 0 | 0 | 0 | 0 | 0 | 0 | 0 |
| Carrying Food | 0 | 0 | 0 | 0 | 0 | 0 | 0 | 0 | 0 | 0 | 0 | 0 |
| Copulating | 0 | 0 | 0 | 0 | 0 | 0 | 0 | 0 | 0 | 0 | 0 | 0 |
| Display | 0 | 0 | 0 | 1 | 0 | 0 | 0 | 0 | 0 | 0 | 0 | 0 |
| Dependent young | 1 | 0 | 0 | 1 | 0 | 0 | 0 | 0 | 0 | 0 | 1 | 0 |
| Faecal sac | 0 | 0 | 0 | 0 | 0 | 0 | 0 | 0 | 0 | 0 | 0 | 0 |
| Inspecting hollow | 0 | 3 | 0 | 3 | 2 | 1 | 0 | 0 | 0 | 0 | 1 | 1 |
| Nest building | 0 | 0 | 0 | 0 | 0 | 0 | 0 | 0 | 0 | 0 | 1 | 0 |
| Nest with eggs | 0 | 0 | 0 | 0 | 0 | 0 | 0 | 0 | 0 | 0 | 0 | 0 |
| Nest with young | 0 | 0 | 0 | 0 | 0 | 0 | 0 | 0 | 0 | 0 | 0 | 0 |
| On/leaving nest | 0 | 0 | 0 | 0 | 3 | 0 | 0 | 0 | 0 | 0 | 0 | 0 |
| All years | ||||||||||||
| Breeding (BLA code) | 0 | 0 | 0 | 2 | 1 | 0 | 0 | 1 | 0 | 0 | 0 | 1 |
| Carrying Food | 0 | 0 | 0 | 0 | 0 | 0 | 0 | 0 | 0 | 0 | 0 | 0 |
| Copulating | 0 | 3 | 0 | 3 | 1 | 0 | 0 | 0 | 0 | 0 | 0 | 0 |
| Display | 1 | 0 | 0 | 3 | 0 | 0 | 0 | 0 | 0 | 0 | 0 | 0 |
| Dependent young | 3 | 1 | 0 | 3 | 2 | 0 | 3 | 9 | 0 | 7 | 5 | 5 |
| Faecal sac | 0 | 0 | 0 | 0 | 0 | 0 | 0 | 0 | 0 | 0 | 0 | 0 |
| Inspecting hollow | 3 | 11 | 25 | 41 | 8 | 7 | 4 | 1 | 1 | 0 | 1 | 4 |
| Nest building | 0 | 0 | 2 | 0 | 0 | 0 | 1 | 0 | 0 | 0 | 1 | 0 |
| Nest with eggs | 0 | 0 | 0 | 2 | 0 | 0 | 0 | 0 | 0 | 0 | 0 | 0 |
| Nest with young | 0 | 0 | 0 | 0 | 1 | 0 | 0 | 0 | 0 | 0 | 0 | 0 |
| On/leaving nest | 0 | 0 | 0 | 3 | 4 | 0 | 1 | 0 | 0 | 0 | 0 | 0 |
Breeding records by year
Average number of breeding records per period by breeding code| Period | Breeding (BLA code) | Carrying Food | Copulating | Display | Dependent young | Faecal sac | Inspecting hollow | Nest building | Nest with eggs | Nest with young | On/leaving nest |
|---|---|---|---|---|---|---|---|---|---|---|---|
| All years | |||||||||||
| All | 0.1 | 0.0 | 0.2 | 0.1 | 1.1 | 0.0 | 2.9 | 0.1 | 0.1 | 0.0 | 0.2 |
| Previous years | |||||||||||
| All previous years | 0.1 | 0.0 | 0.2 | 0.1 | 1.0 | 0.0 | 2.7 | 0.1 | 0.1 | 0.0 | 0.1 |
| Previous 30 years | 0.1 | 0.0 | 0.2 | 0.1 | 1.2 | 0.0 | 3.2 | 0.1 | 0.1 | 0.0 | 0.2 |
| Previous 20 years | 0.1 | 0.0 | 0.3 | 0.1 | 1.4 | 0.0 | 4.7 | 0.0 | 0.1 | 0.0 | 0.2 |
| 10 year groups | |||||||||||
| [2007,2017) | 0.0 | 0.0 | 0.6 | 0.2 | 2.0 | 0.0 | 8.1 | 0.0 | 0.2 | 0.1 | 0.3 |
| [1997,2007) | 0.2 | 0.0 | 0.0 | 0.0 | 0.9 | 0.0 | 1.2 | 0.0 | 0.0 | 0.0 | 0.2 |
| [1987,1997) | 0.0 | 0.0 | 0.1 | 0.1 | 0.6 | 0.0 | 0.2 | 0.3 | 0.0 | 0.0 | 0.0 |
| 5 year groups | |||||||||||
| [2012,2017) | 0.0 | 0.0 | 1.0 | 0.4 | 3.6 | 0.0 | 14.2 | 0.0 | 0.4 | 0.2 | 0.2 |
| [2007,2012) | 0.0 | 0.0 | 0.2 | 0.0 | 0.4 | 0.0 | 2.0 | 0.0 | 0.0 | 0.0 | 0.4 |
| [2002,2007) | 0.0 | 0.0 | 0.0 | 0.0 | 0.8 | 0.0 | 1.6 | 0.0 | 0.0 | 0.0 | 0.0 |
| [1997,2002) | 0.4 | 0.0 | 0.0 | 0.0 | 1.0 | 0.0 | 0.8 | 0.0 | 0.0 | 0.0 | 0.4 |
| [1992,1997) | 0.0 | 0.0 | 0.0 | 0.0 | 0.0 | 0.0 | 0.2 | 0.2 | 0.0 | 0.0 | 0.0 |
| [1987,1992) | 0.0 | 0.0 | 0.2 | 0.2 | 1.2 | 0.0 | 0.2 | 0.4 | 0.0 | 0.0 | 0.0 |
| Year | |||||||||||
| 2017 | 3.0 | 0.0 | 0.0 | 1.0 | 3.0 | 0.0 | 11.0 | 1.0 | 0.0 | 0.0 | 3.0 |
| 2016 | 0.0 | 0.0 | 5.0 | 2.0 | 10.0 | 0.0 | 59.0 | 0.0 | 2.0 | 1.0 | 1.0 |
| 2015 | 0.0 | 0.0 | 0.0 | 0.0 | 2.0 | 0.0 | 6.0 | 0.0 | 0.0 | 0.0 | 0.0 |
| 2014 | 0.0 | 0.0 | 0.0 | 0.0 | 2.0 | 0.0 | 0.0 | 0.0 | 0.0 | 0.0 | 0.0 |
| 2013 | 0.0 | 0.0 | 0.0 | 0.0 | 3.0 | 0.0 | 2.0 | 0.0 | 0.0 | 0.0 | 0.0 |
| 2012 | 0.0 | 0.0 | 0.0 | 0.0 | 1.0 | 0.0 | 4.0 | 0.0 | 0.0 | 0.0 | 0.0 |
| 2011 | 0.0 | 0.0 | 0.0 | 0.0 | 0.0 | 0.0 | 1.0 | 0.0 | 0.0 | 0.0 | 1.0 |
| 2010 | 0.0 | 0.0 | 1.0 | 0.0 | 1.0 | 0.0 | 3.0 | 0.0 | 0.0 | 0.0 | 1.0 |
| 2009 | 0.0 | 0.0 | 0.0 | 0.0 | 1.0 | 0.0 | 1.0 | 0.0 | 0.0 | 0.0 | 0.0 |
| 2008 | 0.0 | 0.0 | 0.0 | 0.0 | 0.0 | 0.0 | 4.0 | 0.0 | 0.0 | 0.0 | 0.0 |
| 2007 | 0.0 | 0.0 | 0.0 | 0.0 | 0.0 | 0.0 | 1.0 | 0.0 | 0.0 | 0.0 | 0.0 |
| 2006 | 0.0 | 0.0 | 0.0 | 0.0 | 1.0 | 0.0 | 4.0 | 0.0 | 0.0 | 0.0 | 0.0 |
| 2005 | 0.0 | 0.0 | 0.0 | 0.0 | 1.0 | 0.0 | 1.0 | 0.0 | 0.0 | 0.0 | 0.0 |
| 2004 | 0.0 | 0.0 | 0.0 | 0.0 | 2.0 | 0.0 | 0.0 | 0.0 | 0.0 | 0.0 | 0.0 |
| 2003 | 0.0 | 0.0 | 0.0 | 0.0 | 0.0 | 0.0 | 1.0 | 0.0 | 0.0 | 0.0 | 0.0 |
| 2002 | 0.0 | 0.0 | 0.0 | 0.0 | 0.0 | 0.0 | 2.0 | 0.0 | 0.0 | 0.0 | 0.0 |
| 2001 | 0.0 | 0.0 | 0.0 | 0.0 | 3.0 | 0.0 | 2.0 | 0.0 | 0.0 | 0.0 | 1.0 |
| 2000 | 2.0 | 0.0 | 0.0 | 0.0 | 0.0 | 0.0 | 2.0 | 0.0 | 0.0 | 0.0 | 0.0 |
| 1999 | 0.0 | 0.0 | 0.0 | 0.0 | 0.0 | 0.0 | 0.0 | 0.0 | 0.0 | 0.0 | 0.0 |
| 1998 | 0.0 | 0.0 | 0.0 | 0.0 | 0.0 | 0.0 | 0.0 | 0.0 | 0.0 | 0.0 | 0.0 |
| 1997 | 0.0 | 0.0 | 0.0 | 0.0 | 2.0 | 0.0 | 0.0 | 0.0 | 0.0 | 0.0 | 1.0 |
| 1996 | 0.0 | 0.0 | 0.0 | 0.0 | 0.0 | 0.0 | 0.0 | 1.0 | 0.0 | 0.0 | 0.0 |
| 1995 | 0.0 | 0.0 | 0.0 | 0.0 | 0.0 | 0.0 | 0.0 | 0.0 | 0.0 | 0.0 | 0.0 |
| 1994 | 0.0 | 0.0 | 0.0 | 0.0 | 0.0 | 0.0 | 0.0 | 0.0 | 0.0 | 0.0 | 0.0 |
| 1993 | 0.0 | 0.0 | 0.0 | 0.0 | 0.0 | 0.0 | 0.0 | 0.0 | 0.0 | 0.0 | 0.0 |
| 1992 | 0.0 | 0.0 | 0.0 | 0.0 | 0.0 | 0.0 | 1.0 | 0.0 | 0.0 | 0.0 | 0.0 |
| 1991 | 0.0 | 0.0 | 1.0 | 1.0 | 1.0 | 0.0 | 1.0 | 0.0 | 0.0 | 0.0 | 0.0 |
| 1990 | 0.0 | 0.0 | 0.0 | 0.0 | 3.0 | 0.0 | 0.0 | 0.0 | 0.0 | 0.0 | 0.0 |
| 1989 | 0.0 | 0.0 | 0.0 | 0.0 | 0.0 | 0.0 | 0.0 | 2.0 | 0.0 | 0.0 | 0.0 |
| 1988 | 0.0 | 0.0 | 0.0 | 0.0 | 1.0 | 0.0 | 0.0 | 0.0 | 0.0 | 0.0 | 0.0 |
| 1987 | 0.0 | 0.0 | 0.0 | 0.0 | 1.0 | 0.0 | 0.0 | 0.0 | 0.0 | 0.0 | 0.0 |
| 1986 | 0.0 | 0.0 | 0.0 | 0.0 | 0.0 | 0.0 | 0.0 | 0.0 | 0.0 | 0.0 | 0.0 |
| 1985 | 0.0 | 0.0 | 0.0 | 0.0 | 0.0 | 0.0 | 0.0 | 0.0 | 0.0 | 0.0 | 0.0 |
| 1984 | 0.0 | 0.0 | 0.0 | 0.0 | 0.0 | 0.0 | 0.0 | 0.0 | 0.0 | 0.0 | 0.0 |
| 1983 | 0.0 | 0.0 | 0.0 | 0.0 | 0.0 | 0.0 | 0.0 | 0.0 | 0.0 | 0.0 | 0.0 |
| 1982 | 0.0 | 0.0 | 0.0 | 0.0 | 0.0 | 0.0 | 0.0 | 0.0 | 0.0 | 0.0 | 0.0 |
Distribution map
Distribution - 2017
This map shows the observed distribution of the Gang-gang Cockatoo for 2017.
The red circles are the grid cells where Gang-gang Cockatoo have been reported.
The transparency of the red circles indicate how many surveys sheets were submitted for that grid cell; the darker the red the more reliable the data. Of the 315 grid cells with reports, 83 had only one sheet; an example is grid number G23.
The size of the circle represents the reporting rate. The maximum reporting rate for Gang-gang Cockatoo was 100.0% (eg grid number G23) and the minimum was 0.4% (eg grid number J17). 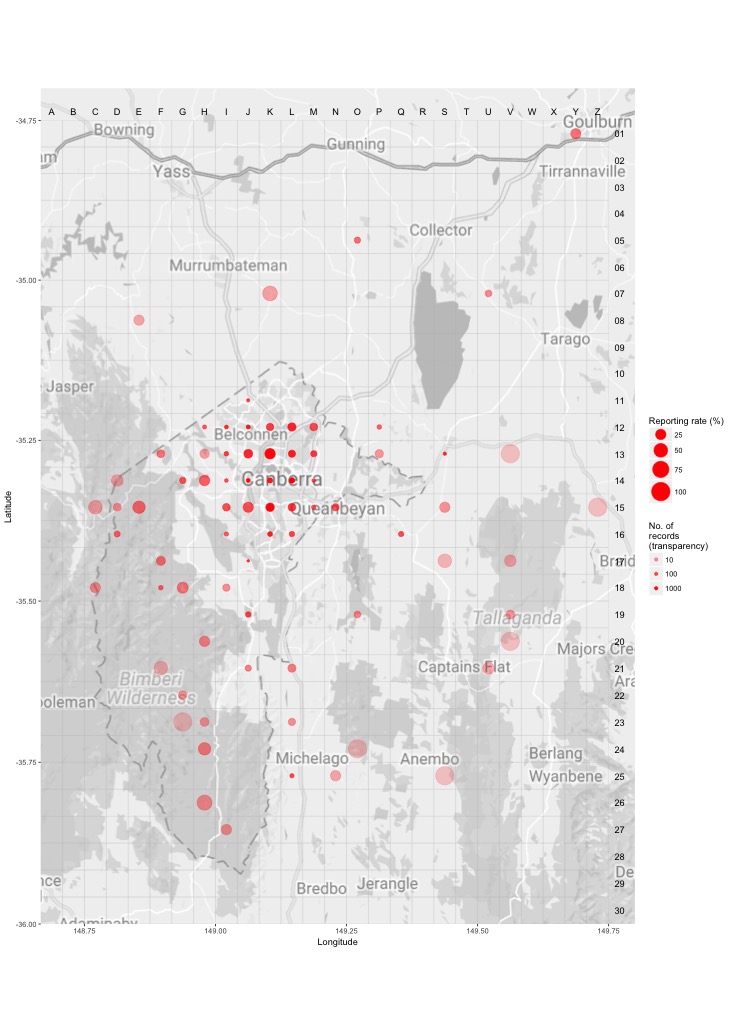
Distribution - all years
This map shows the observed distribution of the Gang-gang Cockatoo for all years.
The red circles are the grid cells where Gang-gang Cockatoo have been reported.
The transparency of the red circles indicate how many surveys sheets were submitted for that grid cell; the darker the red the more reliable the data. Of the 703 grid cells with reports, 55 had only one sheet; an example is grid number B13.
The size of the circle represents the reporting rate. The maximum reporting rate for Gang-gang Cockatoo was 100.0% (eg grid number B13) and the minimum was 0.1% (eg grid number J17). 
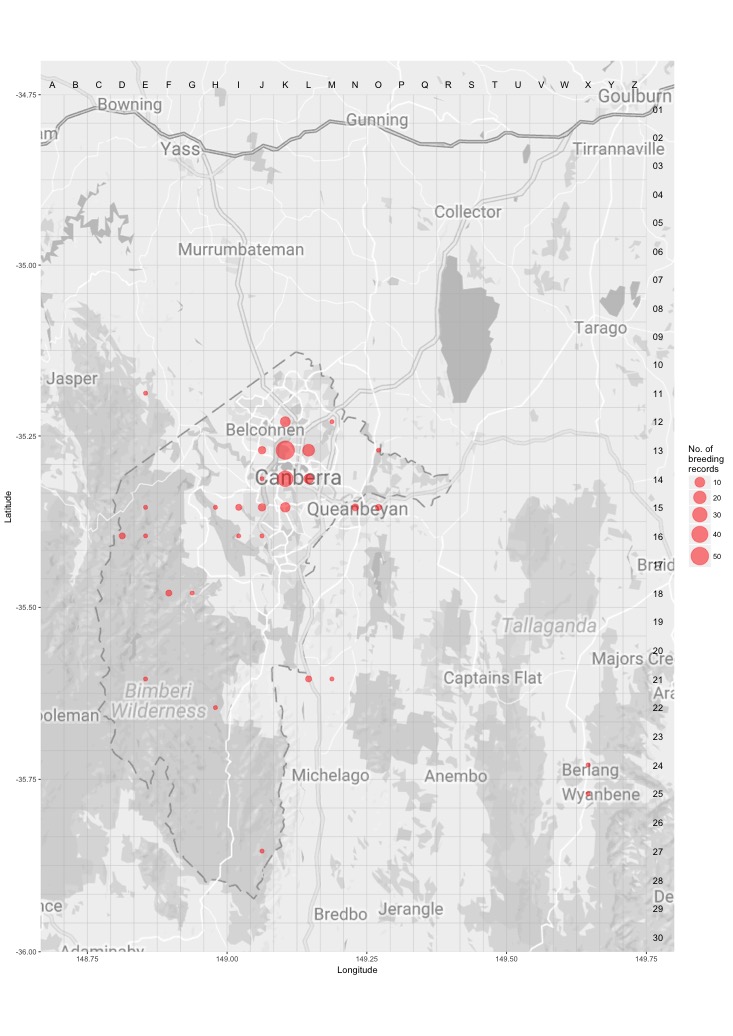
Breeding map
Breeding - 2017
This map shows the breeding distribution of the Gang-gang Cockatoo for 2017.
The red circles are the grid cells where breeding activity for Gang-gang Cockatoo have been reported.
The size of the circle represents the number of reports. 
Breeding - all years
This map shows the breeding distribution of the Gang-gang Cockatoo for all years.
The red circles are the grid cells where breeding activity for Gang-gang Cockatoo have been reported.
The size of the circle represents the number of reports.